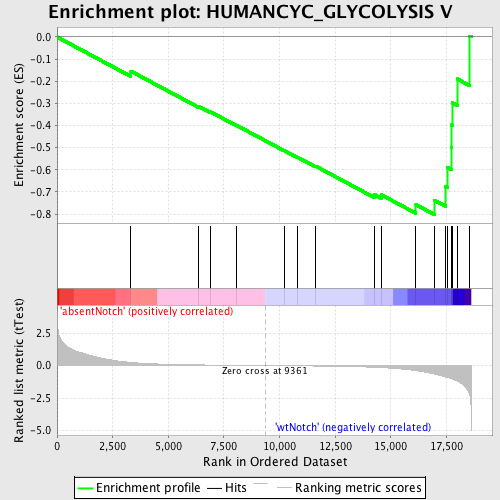
Profile of the Running ES Score & Positions of GeneSet Members on the Rank Ordered List
| Dataset | Set_03_absentNotch_versus_wtNotch.phenotype_absentNotch_versus_wtNotch.cls #absentNotch_versus_wtNotch.phenotype_absentNotch_versus_wtNotch.cls #absentNotch_versus_wtNotch_repos |
| Phenotype | phenotype_absentNotch_versus_wtNotch.cls#absentNotch_versus_wtNotch_repos |
| Upregulated in class | wtNotch |
| GeneSet | HUMANCYC_GLYCOLYSIS V |
| Enrichment Score (ES) | -0.80160993 |
| Normalized Enrichment Score (NES) | -1.7093213 |
| Nominal p-value | 0.0043668123 |
| FDR q-value | 0.06692746 |
| FWER p-Value | 0.411 |
| PROBE | DESCRIPTION (from dataset) | GENE SYMBOL | GENE_TITLE | RANK IN GENE LIST | RANK METRIC SCORE | RUNNING ES | CORE ENRICHMENT | |
|---|---|---|---|---|---|---|---|---|
| 1 | ALDOC | 450121 610427 | 3315 | 0.238 | -0.1544 | No | ||
| 2 | PKLR | 1170400 2470114 | 6361 | 0.050 | -0.3132 | No | ||
| 3 | PFKL | 6200167 | 6892 | 0.038 | -0.3378 | No | ||
| 4 | ALDOB | 4730324 | 8081 | 0.018 | -0.3999 | No | ||
| 5 | GAPDHS | 2690463 | 10205 | -0.012 | -0.5128 | No | ||
| 6 | PGK2 | 2650091 | 10793 | -0.021 | -0.5423 | No | ||
| 7 | BPGM | 5080520 | 11612 | -0.035 | -0.5828 | No | ||
| 8 | ENO2 | 2320068 | 14279 | -0.133 | -0.7128 | No | ||
| 9 | ENO1 | 5340128 | 14569 | -0.157 | -0.7125 | No | ||
| 10 | PGAM2 | 3610605 | 16128 | -0.389 | -0.7573 | Yes | ||
| 11 | PFKM | 1990156 5720168 | 16954 | -0.643 | -0.7371 | Yes | ||
| 12 | PGAM1 | 2570133 | 17466 | -0.875 | -0.6769 | Yes | ||
| 13 | TPI1 | 1500215 2100154 | 17555 | -0.922 | -0.5892 | Yes | ||
| 14 | PGK1 | 1570494 630300 | 17714 | -1.000 | -0.4974 | Yes | ||
| 15 | PFKP | 70138 6760040 1170278 | 17724 | -1.004 | -0.3972 | Yes | ||
| 16 | PKM2 | 6520403 70500 | 17756 | -1.021 | -0.2966 | Yes | ||
| 17 | ENO3 | 5270136 | 17984 | -1.190 | -0.1895 | Yes | ||
| 18 | ALDOA | 6290672 | 18544 | -2.228 | 0.0039 | Yes |

